Premium darkness for serious analytics.
A concept website for a fictional analytics product, built around the physics of emitted light — obsidian layering, luminescent gradients, and a warm gold accent against deep blue-black surfaces.
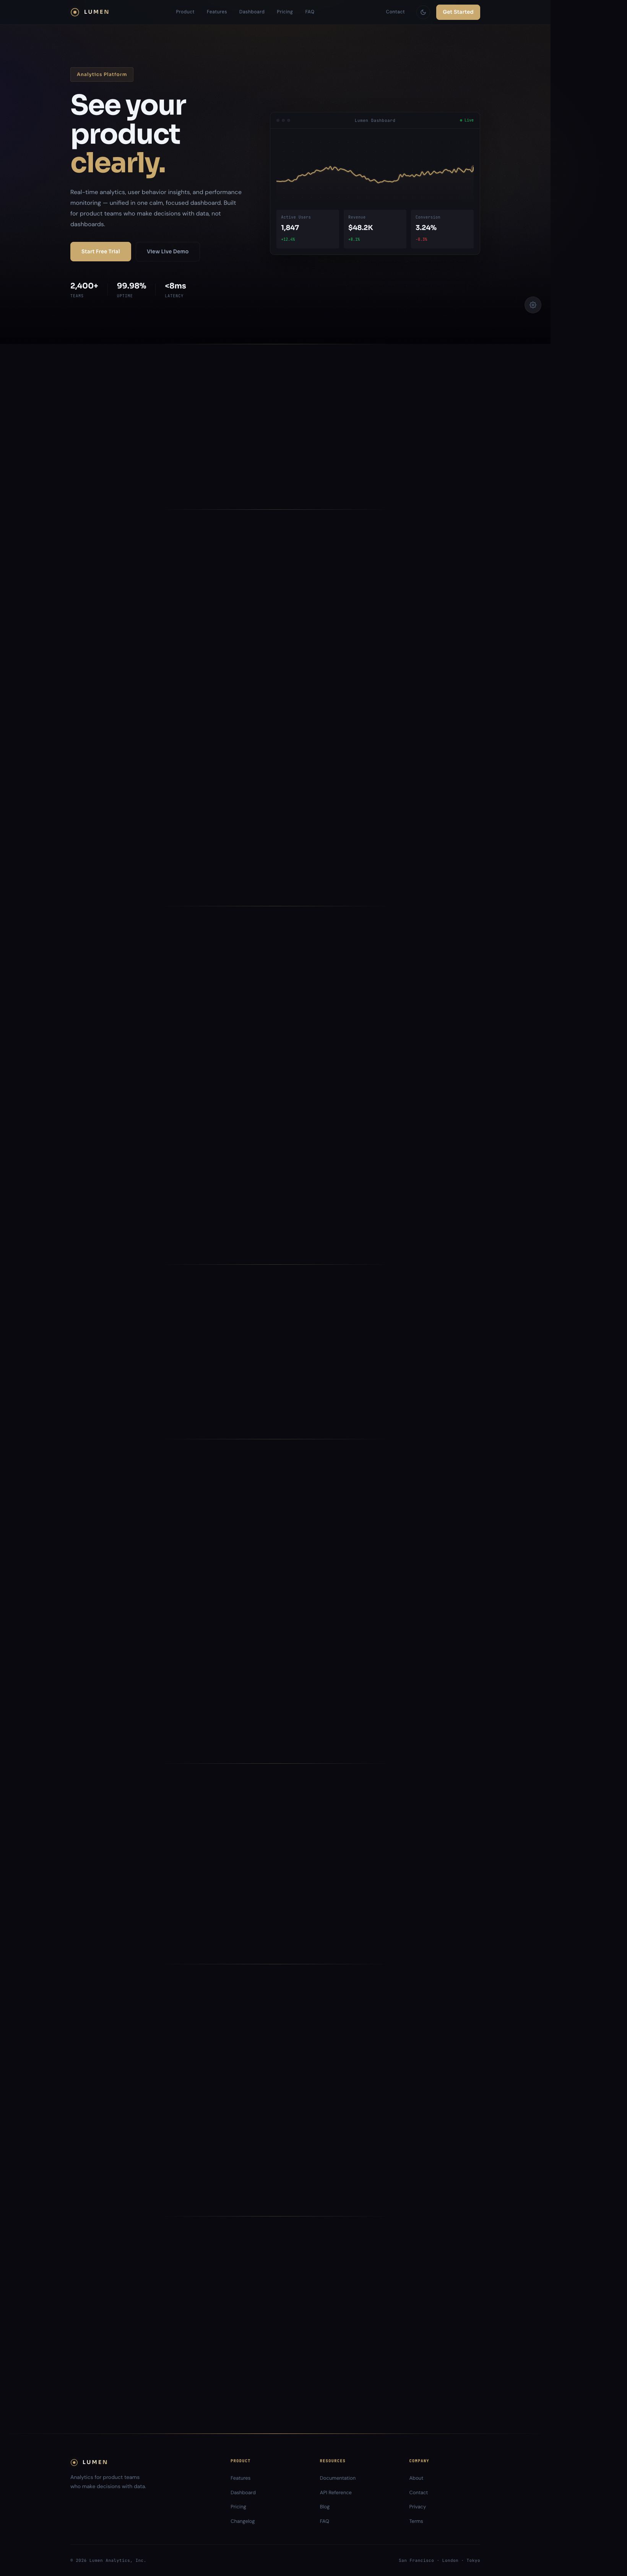
The LUMEN homepage — a light-pipe nav, command-deck hero, and live dashboard mockup.
Overview
LUMEN is a concept website for a premium analytics product. It treats dark mode not as an inverted color scheme but as an atmospheric system: translucent obsidian panels, specular hairline borders, cosmic shadows tinted by neon, and keycap buttons that project glow when pressed. A single warm gold accent cuts through the cool dark to signal what matters.
“Not just black backgrounds — actual atmospheric depth.”
Brief
The concept explored how a data-heavy SaaS product could communicate premium quality purely through atmosphere. The design challenge was keeping a dense product page — features, dashboard, pricing, testimonials — legible and calm inside a dark, light-emitting visual system.
Light, made physical
Typography
- Sora — geometric display for a technology voice
- DM Sans — clean body
- JetBrains Mono — metrics and telemetry
Color
- Obsidian layering from #090D16 up
- Warm gold #C9A96E — the single precious accent
- Icy blue-gray #94A3B8 for secondary text
Surfaces
- Translucent obsidian panels with blur
- Specular 1px hairline borders
- Cosmic shadows with faint neon tint
Signature
- Light-pipe nav that shifts color with scroll
- Keycap buttons with glow projection
- Pulsing status dots and telemetry ticker
Interaction
- Cursor-following radial glow on cards
- Live canvas chart with gradient fill
- Animated dashboard metrics, theme toggle
Atmosphere you can steer
The page reacts to the visitor's presence: feature cards carry a radial glow that follows the cursor via CSS custom properties, and the hero's chart streams data in real time on a canvas — a cyan line with a gradient fill over a subtle grid. The navigation's accent line shifts from cyan to violet as you scroll, tying the whole page to its own light source.
Dashboard metric cards count up when they scroll into view, glowing progress bars fill in cyan, violet, and amber, and a telemetry ticker scrolls endlessly in the footer — all vanilla JavaScript, no libraries.
Built with
Pure semantic HTML5, CSS custom properties with a full token system, and vanilla JavaScript — Canvas 2D for the live chart, IntersectionObserver for scroll-triggered counters, and CSS variables for cursor-tracking glow.
Honest result
A fully responsive concept demonstrating premium technology aesthetics, dashboard design, data visualization, and polished frontend work. It was designed and built from scratch as a personal project — LUMEN is not a real product, and all metrics on the page are fictional placeholder data.
See it running
Open the live concept site and move your cursor across the cards. The source is public on GitHub.