Production, kept steady.
A concept website for a deployment control plane — pipelines, live telemetry, and eight-second rollbacks presented in a modular bento-grid product page.
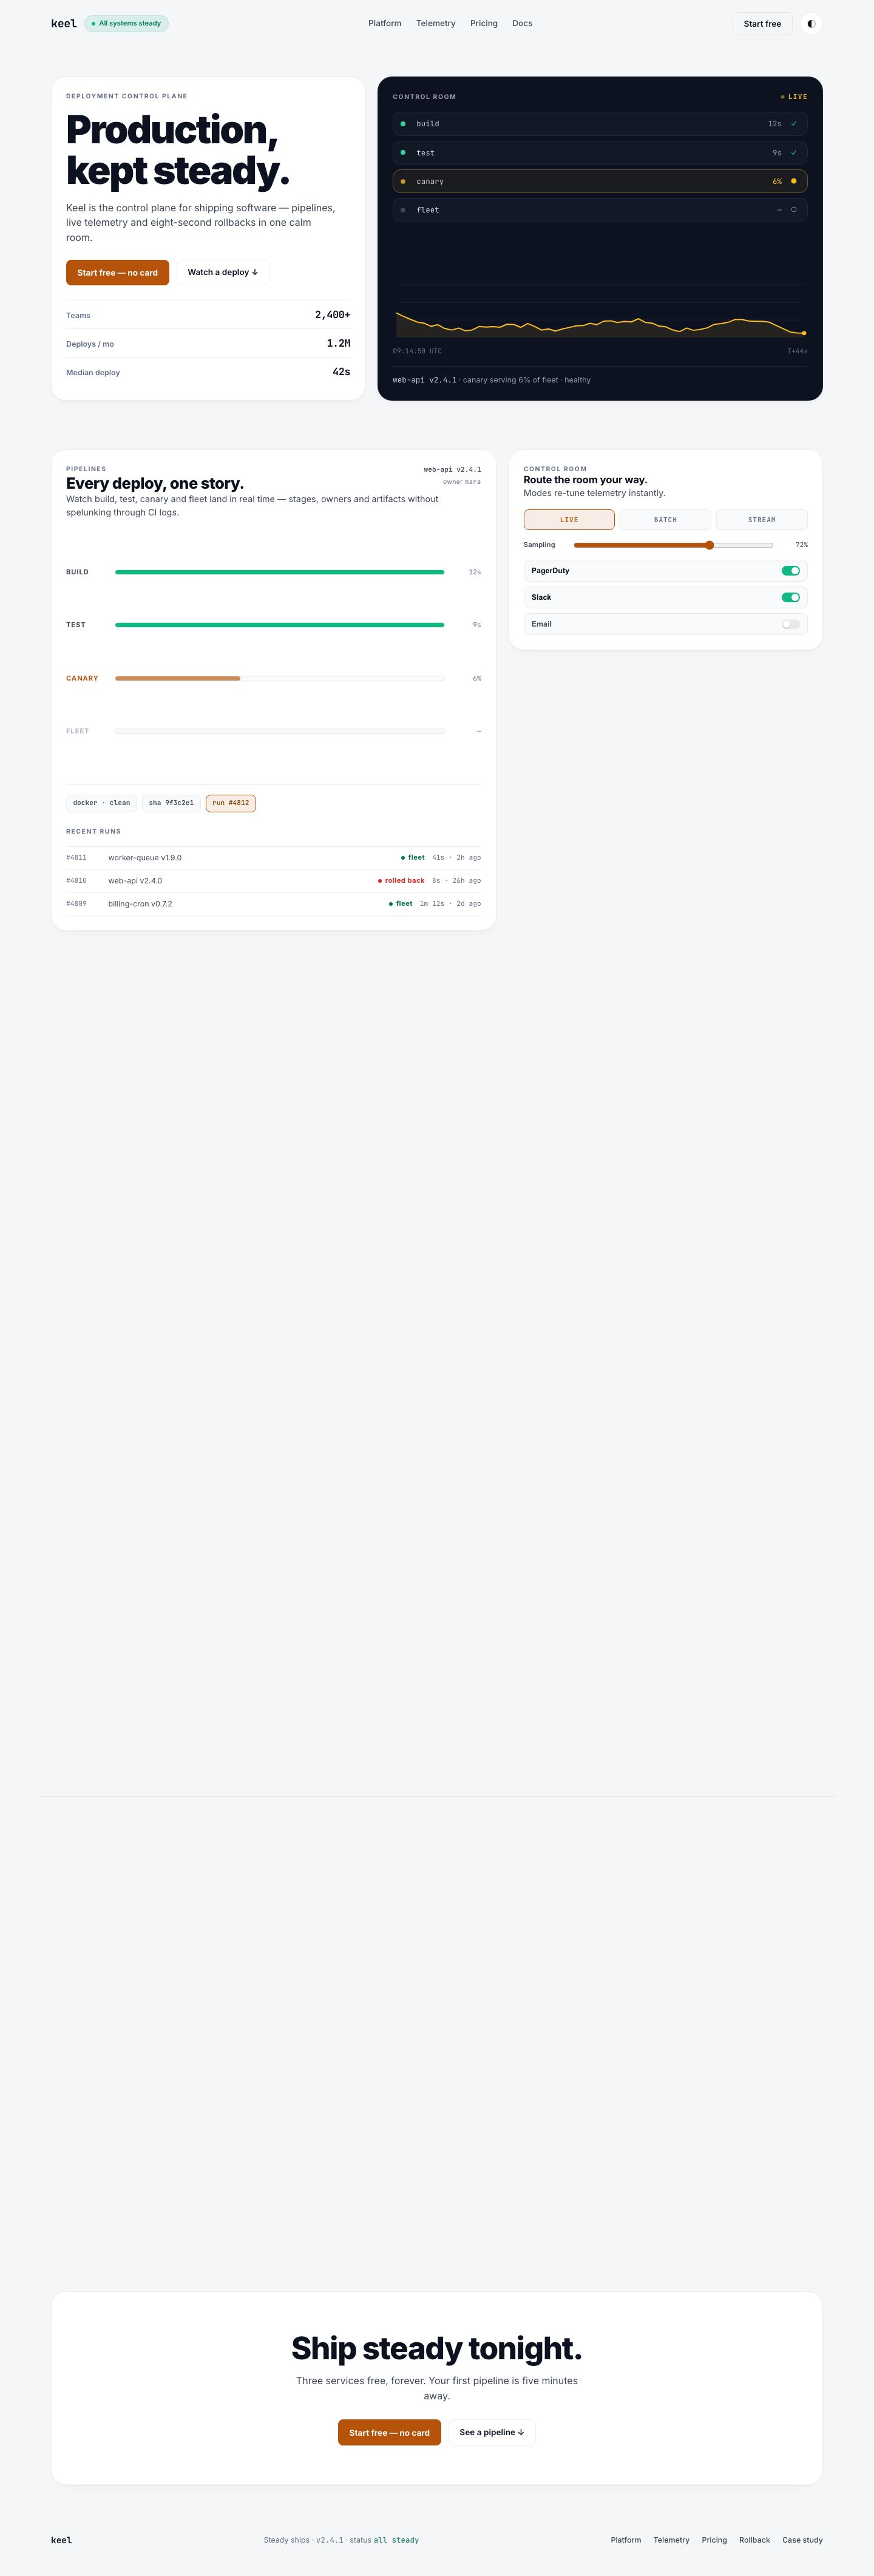
The KEEL homepage — every cell a component, from hero copy to the live control room.
Overview
KEEL is a concept product page for a fictional deployment control plane. The bento-grid layout treats every cell as a self-contained component — hero copy, control room, SLO gauge, telemetry chart, service map, and pricing — arranged with mathematical precision. The whole page reads like the calm cockpit of a serious DevOps tool.
“Keel is the control plane for shipping software — pipelines, live telemetry and eight-second rollbacks in one calm room.”
Brief
The concept explored how a technically dense product could feel calm rather than chaotic. The design challenge was information architecture: fitting real DevOps concepts — deploy stages, error budgets, request topology, p95 latency — into a layout that stays legible at every breakpoint.
A calm control room
Typography
- Inter — clean UI at 400–900 weight
- JetBrains Mono — data, metrics, timestamps
- Monospace status chips add instrument feel
Color
- Paper #F4F6F8 and ink #0C1220 base
- Signal amber #B45309 as the single urgent accent
- Steady green for healthy states
Layout
- Strict CSS Grid bento bands with spanning cells
- Hero copy 5×2, control room 7×2
- Grid reflows 4 → 2 → 1 columns responsively
Materials
- Hairline borders and soft layered shadows
- Rounded 24px cells with 20px gaps
- “All systems steady” status chip personality
Interaction
- Live control room: build → test → canary → fleet
- SLO error-budget gauge with animated needle
- Service map, p95 chart with time ranges, theme toggle
The live control room
The hero's centrepiece is a control room that behaves like the real thing: a sparkline streams in real time, deploy stages progress from build through canary to fleet, and a UTC clock ticks alongside elapsed deploy time. Below it, an SLO gauge reads the error budget and a service map pulses with request topology across regions.
Every visualization is drawn with the Canvas 2D API at runtime — no charting libraries, no images. The telemetry chart supports three time ranges and a rollback takeover animation that dramatizes the “eight-second rollback” promise.
Built with
Pure semantic HTML5 with a CSS Grid bento system, vanilla JavaScript, and the Canvas 2D API for all charts and visualizations. No frameworks, no chart libraries, no build step.
Honest result
A fully responsive concept demonstrating information architecture, product thinking, technical UI design, and modular layout systems. It was designed and built from scratch as a personal project — KEEL is not a real product, and all metrics on the page are fictional placeholder data.
See it running
Open the live concept site and watch the control room do its thing. The source is public on GitHub.